Nuance Over Nonsense
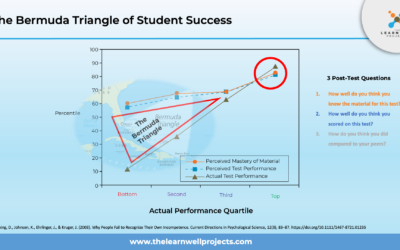
The Bermuda Triangle of Student Success: Where Students’ Hopes for Good Grades Mysteriously Vanish
You've likely heard of the Bermuda Triangle, that mysterious stretch of the North Atlantic where ships and planes are said to vanish without a trace 🚢✈️🌊. It's an urban legend that captures the imagination, hinting at unexplained disappearances and baffling phenomena....

Teach Students to Love Learning: A special Valentine’s Day Post
It’s Valentine’s Day; once again, love is in the air. I want to challenge you today to make your students fall in love with learning. Learning is about establishing relationships with information. If students are to be effective learners, excelling in class and...

The Path to Solving Our Most Persistent Problems: Understanding Student Underperformance
Colleges and universities face a range of challenges, such as retaining new students, ensuring returning students make satisfactory progress, and maintaining high academic standards, all while achieving high levels of community satisfaction. These challenges may...

Overcoming the First Semester Slump: 3 Moves to Enhance College Student Performance
In the initial 2013 release of my article "Why Good Students Do ‘Bad’ in College," I explored the often misunderstood reasons behind college students' underperformance. This post shifted the focus from the stereotype of lazy students to a more nuanced understanding of...

The Spookiest Test Question: What Terrifies Students the Most?
Dive into the mysterious realms of academic testing this Halloween. Discover the one question that haunts students the most! Unveil the secrets in our latest Halloween-themed article. 🎃📚

SUCCESSFUL AND SEAMLESS STUDENT TRANSITIONS
FREE LIVE WEBINAR SERIES: WEDNESDAY, OCTOBER 10, FROM 1:00 P.M. ~ 2:00 P.M. (EASTERN) Are you perplexed by the disparity between students' high school achievements and their college performance? This puzzle has left educators, parents, policymakers and students...

Former STEM Stars Flames Rekindled!
Okay. I'm excited about this post because this makes the fifth time in about four years that I have been a part of the excitement of an institution's academic transformation. It affirms what I deeply believe: academic apathy is a sign of inability, not disinterest....

Note-Taking Cheat Codes
As the college semester or term winds down, students will scour their notes to prepare for their exams. But do they have an effective note-taking method? Their system may be useful for capturing information but not good enough to prepare them for tests. Since much of...
Grades or Outcomes? What’s your preference?
Are you a grades educator or an outcomes educator? I discovered that I had changed from a grades educator to an outcome educator over time. While cleaning out several old work boxes, I found some files from twenty years ago. I came across a folder that I labeled...

Molly’s New Metacognitive Learning Metrics
Have you ever set students up for failure? Well, if you’ve ever advised students to study X number of hours for every hour of class time, then you have set them up for failure. No worries. You didn’t intend to harm them. But by encouraging students to use time to...

Introducing The Learner’s Formula
Professionals in all fields rely upon processes to do consistently high-quality work. We need processes most when our jobs require us to handle high volumes of work or when the work is complex. Take painters for example. Professional painters use the "W Method" to...

Help Students Differentiate Thinking Skills with Metacognitive Tools
Students will begin the 2022–2023 academic year in our post-quarantine world with optimism and excitement to join their peers on campus. But many students will soon struggle as the reality of college work sets in. Their academic success depends on their ability to...
Call Us Today 1-866-337-3030
